
Experimental statistic
- Home
- /
- Experimental statistic
- /
- Use of the Open...
Use of the Open Street Map to calculate indicators for road accidents on the Italian roads | Year 2023
Istat updates the experimental statistics on “Use of OpenStreetMap for calculating indicators of road accidents on the Italian road network”, referred to 2023 data, last available. Previous editions refer to 2016 and 2017 data and remain available on the Istat experimental statistics website. After this release, updates will follow for the unpublished data, starting with the data for 2022 and going back to the data for 2018.
When calculating statistical indicators for road accidents, the current choice of denominators distorts the information. The resident population, often used as the denominator, does not always provide an appropriate measure, especially considering the seasonality of accidents. Vehicle fleets by province of registration (PRA – ACI) offer more precise information than population data but introduce distortions linked to mobility across territories.
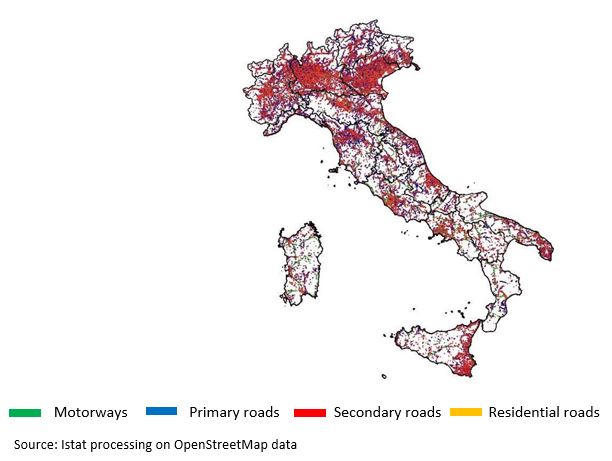
The length in meters of carriageway per traffic direction for each road segment (from OpenStreetMap) provides a consistent initial set of information for different territories. Official national statistics do not provide this information. Although detailed road graphs exist for each municipality, province, and region, authorities have not yet established a harmonized national road registry.
In the current update of the experimental statistics, the team:
- used Traffic Points located on road segments extracted from OSM;
- adopted the detailed classification of road segments and linked it, through a correspondence table, to the road localization classification used by Istat for road accident data collection;
- produced composite indicators using a generalized Istat tool, Ranker, which allows setting the indicator polarity;
- adjusted the composite indices to remove the “traffic factor” influence and applied a negative polarity to express risk levels in individual territorial units (Italian provinces).
The project includes, alongside traditional indicators on population and vehicle fleet, the calculation of road accident, mortality, and injury rates using the length in meters of carriageway per traffic direction from OpenStreetMap as the denominator. The analysis also involved constructing composite indicators through the RankerTool, a standard tool developed by Istat.
Although this product represents a first result, the project’s ultimate goal aims to estimate actual traffic flows (vehicles/km) on the national road network and the associated accident risk. To fill this information gap, the team extracted additional data from OpenStreetMap, specifically traffic points located on road segments. OSM provides downloadable monthly data on the locations of points where traffic intensity registers for individual road segments.
Since the previous update, the team shifted from a systematic classification of road segments to a new analytical classification. They applied a more refined technique to assign the approximately three and a half million road segments in OpenStreetMap to categories used by Istat for road accident localization.
Finally, it is important to note that the Ranker software, used to calculate composite indicators, requires setting the indicator’s polarity to define a ranking of values, assigning a specific meaning with either a positive or negative sign.
For the 2023 composite indicators, the team set the polarity as negative to highlight higher danger related to road safety in provinces with higher absolute indicator values.
The 2023 data update also included the “traffic factor.” The weights used to calculate the indicators for road extension represent the complement (1-p) of the percentage (p) of road extensions with traffic points. This approach removes the traffic effect from the indices and highlights the consequences of driver behavior and infrastructure weaknesses. The team therefore found it more intuitive to use a negative polarity for the indicator, relating it to disadvantageous conditions in the provinces.