
Frequently asked questions on consumer prices
1. What does the term “inflation” mean?
The term “inflation” refers to the phenomenon of a continuous and generalized rise in prices, leading to a reduction in the purchasing power per unit of money over time (in contrast, “deflation” takes place if prices show a widespread and persistent downward trend). A rise of inflation corresponds to an increase of the speed of price growth, while a decrease of inflation occurs when prices, although rising, grow at a slower speed.
2. What does a loss of purchasing power mean?
A loss of purchasing power implies a reduction in the number of goods and services that can be bought with a fixed amount of money. If the prices of products rise over time, with the same amount of money spent, consumers will be able to buy an ever smaller quantity of the same products.
3. How is inflation measured?
Inflation is measured as the price change of a large group of goods and services (known as “basket”), representative of the household consumption expenditure. In Italy, as in other European Countries, the index is calculated by the National Institute of Statistics. ISTAT produces three different indices: the Consumer price index for the whole nation (NIC); the Harmonized Index of Consumer Prices (HICP) and the Consumer price index for blue and white-collar worker households (FOI). NIC is used to measure national inflation. HICP is used for the comparison of inflation among the EU Member States and is calculated basing on a shared conceptual, methodological, and technical framework; FOI is generally used for monetary revaluations.
Concerning NIC and FOI, in 2024, the basket includes 1,915 items (from pasta to passenger air transport, from bread to personal computers, or from petrol to coffee at a bar, etc.) representing the universe of products purchased by households. The 2023 HICP basket is made up of 1,936 items.
Since March 2012, Istat has been also releasing HICP at constant tax rates (HICP-CT) which follows the same computation principles as the HICP but it is based on prices “at constant tax rates”, which are estimated canceling out the effects due to changes in indirect taxes (VAT, excise duties and other taxes on some specific items).
4. Where can I find the figures on consumer price indices?
The most up-to-date data (indices, cyclical and trend variations) can be found on the (IstatData) data warehouse and at Statistical Information Centres.
From the point of view of territorial disaggregation, the NIC and FOI indices (both from January 1996) are disseminated at the national and sub-national level, while the HICP (since January 2001) and HICP-TC (since January 2002) indices are disseminated only at the national level. Finally, in (IstatData), together with monthly and annual average indices, percentage rate of changes (on monthly, annual and annual average bases) and weights are also available.
5. Which prices are collected to calculate the consumer price index?
With reference to FOI and NIC indices, in 2023 the prices of 1,915 representative goods and services, included in the basket, are collected on a monthly basis (1,936 for the HICP).
According to the COICOP classification, products are classified into 12 expenditure divisions: Food and non-alcoholic beverages; Alcoholic beverages, tobacco; Clothing and footwear; Housing, water, electricity, gas and other fuels; Furnishings, household equipment and routine household maintenance; Health; Transport; Communication; Recreation and culture; Education; Restaurants and hotels; Miscellaneous goods and services. Within each division, a weight is attached to each single good or service, which reflects its relative importance in terms of budget share in the consumption expenditure of households. For example, in the NIC basket, the weight of bread is approximately less than 1%, that of a meal in a pizzeria is about 1.3%, and the weight of new cars is less than 3%. To find out the weights (updated to the specific reference year) with which different products contribute to the measurement of inflation, please refer to the Information Note, typically published with the release of provisional data for the month of January of the current year, available on the Institute’s website.
6. How are the goods and services in the basket selected?
The products in the basket and the weight attributed to them are defined according to household consumption expenditure, in order to represent the structure of the population’s consumption. Each year a sample is specified, which is made up of the products whose price dynamic is representative of that of a wider range: for example, to calculate the variation in prices of the “Small electrical appliances” consumption segment, the prices of plugs, electric batteries, adapter plugs, LED bulb and smart bulbs are monthly collected.
The identification of major household expenditure aggregates and the estimation of their weights is carried out using as main source National Accounts data on household final consumptions. These major expenditure aggregates, up to the selection of single products and the estimation of their weights, are detailed using several sources available both inside (Household consumption expenditure) and outside Istat (figures from A.C. Nielsen, Siae, etc.) in order to ensure an accurate coverage.
7. Is the basket always the same?
The basket is updated every year to reflect the actual purchasing behaviors of households and to account for changes in these behaviors and in product offerings on the market. Every year, Istat revises the list of products and services that make up the reference basket for consumer price collection, simultaneously updating the survey techniques and the weights with which different products contribute to the measurement of inflation. To learn about the updates to the basket for the current year, please refer to the annual Information Note, usually published with the release of provisional data for the month of January of the current year, available on the Institute’s website. Along with the annual Information Note, the evolution of the basket from 1928 to the current year is also published, allowing insight into the main expenditure categories considered over the years and the respective consumption segments included in the consumer price basket each year.
8. Where are prices collected?
The survey conducted by the Municipal Statistical Offices takes place in the municipal territories of regional capital cities, provincial capitals, and, in one case, cities with a population of more than 30,000 inhabitants. To know the coverage of the survey conducted by the Municipal Statistical Offices and the number of municipalities participating in the calculation of indices for all product aggregates of the basket, or only for a subset of these, please refer to the annual Information Note on basket updates, usually published when provisional data for the month of January is released, available on the Institute’s website. Prices are collected by Municipal Statistical Offices staff from over 44,000 collection units (retail outlets, including small retail businesses, large-scale retail distribution, and local markets; businesses; institutions). The selected collection units are updated annually by municipalities based on changes in consumption habits, distribution networks, and urban structure, following guidelines provided by Istat, which conducts coordination and supervision activities.
In addition to prices collected in the territory, prices directly obtained by Istat are added, acquired via the web, also using web scraping procedures, or gathering information from external sources (such as the Insurance Supervisory Institute Ivass, for auto liability insurance prices, or from Farmadata, for prices of class A and C COP drugs, or from the Offers Portal and the Regulatory Authority for Energy Networks and Environment ARERA, respectively for energy and gas offers in the free market and for energy and gas rates in the regulated market).
Scanner data, on the other hand, are collected from five types of distribution channels of the Large-Scale Retail Trade (GDO): hypermarkets, supermarkets, discount stores, self-service stores (retail outlets with surfaces ranging from 100 to 400 square meters), and specialist drugstores (specialists in home and personal care products). Additionally, since 2017, fuel price indices are calculated using an administrative source, which is the fuel price database of the Ministry of Enterprises and Made in Italy (the information used comes from over 15,000 distributors, representing almost 70% of those active and present in the MIMIT database).
Regarding the use of administrative sources for the calculation of consumer prices, there are also data provided by the Customs and Monopolies Agency on tobacco, and since 2022, data on real estate rentals from the Real Estate Market Observatory of the Revenue Agency on rent for privately owned residences.
9. How are the figures collected?
Data are collected from different sources and with different technologies:
- the traditional price collection on the fields, conducted by Municipal Offices of Statistics, covers over 50% of the NIC basket (in terms of weight);
- the centralized price collection (nearly 26% of the basket in terms of NIC weights) is carried out directly by Istat by means of automatic data download techniques (web scraping), from the Internet or by acquisition from large data providers;
- prices of grocery products are collected through scanner data with regard to the large scale retail trade distribution channels (almost 14% of the basket);
- the administrative sources are also used: the database of fuel prices of the Ministry of Economic Development for the price collection of automotive fuels ; the data provided by the Real Estate Market Observatory of the Tax Office (introduced this year) for the survey of the prices of real rentals for private dwellings and the Excise, Customs and Monopolies Agency for the survey on tobacco products. Together, administrative sources cover just over 10% of the basket’s products.
With reference to the survey on the field, at the beginning of each year, Istat sends to the Municipal Offices of Statistics a list of the products to be collected, where each good or service is accompanied by a series of specific information (e.g. packaging type for food and household goods or model and fabric for clothing, allowing for the same product to be collected all over Italy. For each product, the data collector is responsible for identifying, within the selected outlet the most sold elementary item (“product offer”) within those ones that have the characteristics set out by Istat. The price of the same product will be monitored every month for a whole year.
As for the centralized data collection, it includes:
- those products that have the same price in the entire national territory (such as tobacco, periodicals, medicine of class A);
- telephone services;
- some transport services;
- national and international package holidays;
- products that are subject to constant technology changes (computers, mobile phones, etc.);
- some recreation services (campsites, bathing establishments, farm holidays, etc.).
The central survey is mainly carried out via Internet also by new data collection techniques which use web scraping automatic procedures.
Concerning the prices of grocery products (processed food, goods for cleaning and ordinary maintenance of the house and personal hygiene and beauty products) it is carried out using data scanner and affects five distribution types of the large-scale retail trade: hypermarkets, supermarkets, discounts, small sales areas ( also known as “self-service”, points of sale with an area between 100 and 400 square meters) and specialist drugs. The constant use of information from large-scale retailers to estimate inflation was made possible thanks to the fruitful collaboration of the Association of Modern Distribution and the main chains operating in Italy. The agreement provides for the data to be acquired by Istat through the A.C. Nielsen firm, subject to authorization for the use of data by large-scale retail chains.
10. When and how often the prices are monitored?
With regard to the data collection of the field, the price survey is carried out in the first fifteen working days: twice a month for those products that show sharp and irregular price changes within the month (fresh fruit, vegetables and fish, heating oil); three times a month for hotel room prices and once a month for the other products. Concerning the centralized data collection, prices are usually collected once a month in the first fifteen working days of the month with some exceptions (transport, newspapers and periodicals, touristic, recreational and cultural services, etc.) for which prices are collected on different temporal occasions within the reference month. For the calculation of fuel price indices, prices from the Ministry of Enterprises and Made in Italy database are collected three times a month: on the first, eleventh, and twenty-first days of the month. As for scanner data, Istat uses prices from the first three weeks of the reference month for the calculation of final indices (the first two weeks for provisional indices).
11. Are discounts monitored, too?
Yes, they are. For the HICP calculation, discounts are collected if discounts are temporary, or rather they are applied in the occasion of extraordinary sales (selling-off, end-season sale or sales promotion, provided supplied product has an adequate range of models).
Starting from 2014, the discount survey has been extended to cases of “take 2 pay 1” or “take 3 pay 2” and to reduction prices related to the possession of “loyalty cards” which can be acquired for free.
NIC and FOI indices include discounts only when applied without interruption for a period longer than three months.
12. Are consumer price figures checked?
Checks take place both on a local and a central level. In particular, with reference to the data collection on the field, the Offices of Statistics in the municipalities involved in the survey must provide Istat with a list of the single outlets visited and the products recorded in each of them. Furthermore, by Law, each municipality must establish a Municipal Control Commission, chaired by the mayor or his delegate, with the task of verifying the prices collected, the methods by which the figures are processed according to Istat recommendations and the correspondence between the number of data collectors employed and the real needs of the survey. Istat, in its turn, performs checks and coherence controls on the information received from both the 79 municipalities which participate in the indices calculation of all representative items included in the basket and the 12 municipalities participating in the survey for the subset of products which include local tariffs and services.
13. What happens once each price has been recorded?
Using the price quotations recorded in the municipalities involved, those recorded on a central level and those coming from administrative sources, Istat draws up an elementary index for every single product. The elementary indices are then aggregated to produce the indices of the higher levels of the classification at the regional, macro-areas and national.
14. How are seasonal products indices calculated when seasonal products are out-of-season?
Seasonal products are mainly fresh fruit, fresh vegetables and clothing and footwear products. For those goods, in accordance with the European Regulation on the treatment of seasonal products in the HICP n. 330/2009, Istat has defined a monthly calendar that establishes the months when a product has to be collected and the months when it has not. When a product is not collected because out-of-season, in that month, its price is estimated. The estimate is carried out applying to the last price available the change in observed prices on average over all seasonal products which, in that month, are in-season in the same group. For instance, concerning the men’s suit, the basket includes both the winter and the summer ones; starting from March, the winter suit is no more surveyed and from then its price is estimated applying to the last price available the change observed in prices of summer suit.
15. Why do consumers sometimes have the impression that price dynamics are different from that recorded by Istat?
First of all, it should be noted that the consumer price index measures price variations in the whole range of goods and services available to purchase in the Country. In other terms, the index considers the Country as it were one big family of consumers. The expenditure habits of an individual consumer, of course, may differ from those of the population as a whole. Hence there are difficulties for some consumers, in some cases, to recognize in the overall price variations of the entire present population’s expenditure the dynamics of prices referred to their own daily expenditure.
In practice, some products which undergo marked price rises, can be purchased frequently and/or can have a high weight in the budget of an individual consumer but have a low incidence on the expenditure of the entire population (for example, a commuter who spends a high proportion of his income for a train pass, in the presence of a marked increase of prices of rail transport, can hardly recognize in the change of the all-item index where the weight of transport by train on NIC general index is a bit less than 0.3%); likewise some products which undergo marked price decreases can be among those less frequently purchased and with low weight on the budget of an individual consumer but can have a high incidence on total expenditure of the population as a whole (for example, a consumer who does not own a car will have few benefits from a significant decline of car insurance prices, which, instead, weighs in the NIC basket about 1.1%).
16. Why do some items, such as housing rentals or car insurance, seem to weigh much more on household budgets than the weight attributed to them in the basket?
Housing Rentals account for approximately less than 3% of the basket’s weight (considering the NIC) because only slightly more than 25% (source: Istat Survey on Living Conditions EU-SILC) of Italian families live in rented accommodation. The all-items index is obviously influenced by this phenomenon: in practice, expenses borne by only a portion of Italian families are spread across the entire population. The weight of vehicle insurance, which has an impact of about 1.2% on the NIC general index, is considered by evaluating the premiums paid by households during the year net of compensation (i.e. it takes account of the compensation paid to households in the case of a claim). Its weight in the basket reflects this calculation method which, at first glance, penalizes households that did not present any claims, since they pay the premium but do not receive compensation. Once again, households in Italy are considered single-family that sustain a single expense (the insurance premium) and receive a single compensation. This evaluation method is also used in most European Countries, in compliance with an EU regulation.
17. Why is the expense of dwelling purchase not considered when calculating inflation?
According to the European system of national and regional accounts (Esa 2010), dwelling purchase represents an expense for investment and not consumption. Nonetheless, the calculation of consumer price indices does consider the expenses associated with housing: water supply, electricity, fuel (gas or heating oil), expenses for minor housing repair and maintenance (electrician, plumber, construction workers, tiles, bathroom taps, etc.) and housing association costs.
With regard to house prices, in accordance with European Regulations (the Regulation (EU) 2016/792 of the European Parliament and of the Council of 11 May 2016 on harmonised indices of consumer prices and the house price index and Commission Implementing Regulation (EU) 2020/1148 of 31 July 2020), from October 2012 Istat publishes quarterly the House Price Index (HPI, see Italian IPAB) which refers to all residential properties purchased by households for own-occupancy or as an investment. Furthermore, Istat releases to Eurostat price indices which cover residential properties purchased by households only for their own use (OOH, Owner Occupied Housing indices). The OOH indices are currently published on the Eurostat website but are not yet integrated into the HICP, as required in Regulation 2016/792, as they do not correspond in terms of frequency and timeliness (as emerged from the 2018 Commission report). At the moment, the possibility of calculating aggregate OOH indices at a European level is being evaluated while the methodological work necessary for their integration in the calculation of inflation continues.
18. Is there a way to calculate how price variations affect the purchasing power of households, depending on their spending habits?
Yes, there is; but it must be emphasized that the inflationary impact on household expense budgets depends on the spending habits of the single household. In fact, each household has different behaviors and purchases goods and services, that are different in terms of quantity and characteristics and in different types of outlet (traditional store, supermarket, hard discount etc.), taking into account its available income, the age and the professional condition of its members and so on.
Given the difficulty in identifying the structure of consumption by income classes, it was decided to estimate the impact of inflation on households, distinguished according to their levels of consumption (starting from the first household group with the lowest spending power until the last household group with the highest spending power). Therefore, from 2013, Istat calculates, and releases quarterly, the HICP indices referred to different groups of households, which are defined according to their consumption expenditure level. For each group, different weighting systems are estimated in order to take into account the relative different relevance of the expenditure items in the household budget.
19. How are consumer price indices published?
Concerning NIC and HICP indices, dissemination takes place monthly with two press releases: with the first one (generally published at the end of the reference month), a flash estimate of inflation is released; with the second one, final data on inflation, which take into account all data and the ending of editing operations, are released. For FOI and HICP-CT indices, dissemination takes place only when final data are released. At the same time of Istat’s final estimate of inflation release, also 3 municipalities disseminate directly, by press release, the estimate of inflation (measured by NIC) referred to their territory.
20. Are Eurostat, the European Union Statistics Bureau, indices different from those published by Istat?
They are the same figures. In fact, the HICPs are calculated, released and sent to Eurostat by Istat on a monthly basis, according to a pre-established calendar. Eurostat, in its turn, publishes the harmonized indices for the single EU Countries and uses them to calculate and release the synthetic European index.
21. Which consumer price index is used to update rentals, maintenance payments and TFR employee leaving indemnity?
Monetary values, such as rentals, maintenance payments for separated partners and TFR indemnity, are periodically updated using the Consumer price index for blue- and white-collar worker households (FOI) net of tobacco. The figures can be found in the Price index for monetary revaluations section. Furthermore, starting from December 2011, on the Istat website the system Rivaluta is available and it permits to carry out updating of monetary values by the calculating instrument. Finally, an automatic response system is also active at the following number: +39 06 4673.3105.
22. How do I calculate the monthly rate of change?
The percentage rate of change between the index of one month m and that of the previous month, m-1, is equal to their ratio, multiplied by 100, less 100; the final result is rounded to 1 decimal place.
For example, the percentage rate of change between the index of February 2011 and the index of January 2011 is
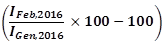
the final result is rounded to 1 decimal place.
If the reference base for the indices compared is different, the splicing coefficient is used. For example, with the updating of the reference base year to 2015 for NIC and FOI indices (the previous base was 2010=100) starting from data of January 2016, the percentage rate of change between the January 2016 and December 2015 indices is
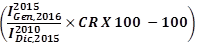
the final result is rounded to 1 decimal place.
CR is the splicing coefficient from the reference base year 2010 to the reference base year 2015 and it is equal to the average index of 2015 expressed in the base year2010, divided by 100.
23. How do I calculate the annual rate of change?
The percentage rate of change between the index of month m in year t and the index of the corresponding month of the previous year t-1 is equal to their ratio multiplied by 100, less 100; the final result is rounded to 1 decimal place. For example, the percentage rate of change between the index of February 2015 and that of February 2014 is
![]()
the final result is rounded to 1 decimal place.
If the reference base for the indices compared is different, the calculation uses the splicing coefficient. For example, with the updating of the reference base year to 2015 for the NIC and FOI indices (the previous base was 2010=100) starting from data for January 2016, the percentage rate of change between the February 2016 index and the February 2015 index is
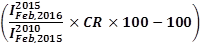
the final result is rounded to 1 decimal place.
CR is the splicing coefficient from the reference base year 2010 to the reference base year 2015 and it is equal to the average index of 2015 expressed in the base year2010, divided by 100.
24. How do I calculate the annual average rate of change?
For the NIC and FOI indices, the percentage rate of change between the average index of year t and the average index of year t-1 is equal to their ratio multiplied by 100, less 100; the final result is rounded to 1 decimal place.
For example, the percentage rate of change between the average index of 2015 and that of 2014 is
![]()
the final result is rounded to 1 decimal place.
If the reference base for the indices compared is different, the calculation uses the splicing coefficient. For the use of coefficients in calculating the percentage rate of change between indices on different bases, please refer to the Methodology notes attached to the Press release – Consumer prices.
Otherwise, in line with Eurostat recommendations, for the HICP index the annual average rate of change is obtained directly from the monthly indices; therefore, for example, the percentage rate of change between the average index of 2015 and that of 2014 is
![]()
the final result is rounded to 1 decimal place.