
Experimental statistic
- Home
- /
- Experimental statistic
- /
- Use of the Open...
Use of the Open Street Map to calculate indicators for road accidents
Istat updates the Experimental Statistics on “Use of the open street map to calculate indicators for road accidents on the Italian roads, disseminated for the first time in July 2019.
Nowadays there is a clear information bias as regards the appropriate reference denominators to be placed as basis in construction of statistical indicators linked to road accidents. Resident population is used as a common proxy for exposed at risk in a specific geographical area, but not always an appropriate solution, especially in the light of the seasonal nature of road accidents and concentration, in some periods of the year, in specific locations. Vehicle fleet (Automobile Club of Italy – ACI) can be another administrative source that gives a more accurate information, but the characteristic of the phenomenon implies a deductible distortion on measures due to the mobility of road users.
The length of the road network (from Open Street Map) gives for sure a consistent first set of information concerning the different territories. This information is not available from official statistics at national level, although there are archives and detailed road graphs for each municipality, province and region, a harmonized and systematic national road registry has not been established.
The main changes contained in the update of the experimental statistics are:
- use of the Points of Traffic on the road arches, this is a new information derived by OSM;
- definition of a new analytical classification of the road arches rather than systematic and processing of a new bridge coding table with the road localization classification used by Istat;
- production of new synthesis indicators developed with a generalized Istat tool, Ranker, which allows to set an indicator polarity;
- exclusion of the “traffic weight” in the synthesis indicators, adoption of the negative polarity and adjustment of the previous indicators.
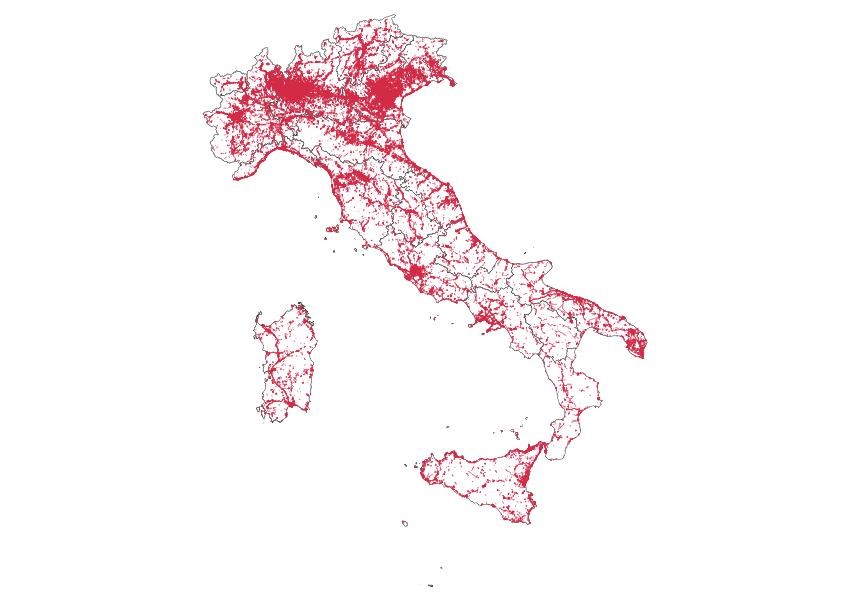
(fig. Points of Traffic on the road arches)
The project includes, together with the traditional indicators out of population and vehicle fleet, the calculation of accident, mortality and injury rates, using as the denominator the length in meters of carriageway for each direction of road arch from Open Street Map. The analysis was completed with the construction of synthesis indicators, using RankerTool, a standard tool developed in Istat. Although the product establishes a first result, the final aim of the project is to estimate the traffic flows (vehicles / Km) on the national road network and the risk of accidents. To fill in this gap, additional information was obtained from the Open Street Map, specifically, the data on Points of Traffic on the road arches. Monthly downloadable information, in fact, is available from OSM.
It should be noted that the systematic classification of road arches from the Open Street Map into the road categories, used by Istat for the previous edition of the experimental statistics, has been changed with respect to what was done for the first release.
We have moved, in fact, from a systematic classification of road arches to a new analytical classification, obtained through a more refined technique in the attribution of the typologies of the single road arches in Open Street Map, about three and a half million in total, to the classification used by Istat for the localization of road accidents.
In order to use the classified data with the contribution of the improved technique and, at the same time, to guarantee the comparability with the information referred to 2016, already disseminated, the 2017 indicators include a recalculation of the provincial rankings, determined with the 2016 systematic classification too.
It should be noted that the Ranker software, used for the calculation of synthesis indicators, requires to set the “polarity” of the indicator in order to define a values ranking, attributing a specific meaning with a + or – sign.The 2016 synthesis indicators were calculated by setting the polarity with a positive sign, to highlight the greater danger associated with road safety in the provinces, if a high value of the indicator stated. For 2017 data, an additional element was included, the “points of traffic factor“. The new weights used for the calculation of the indicators for road length are represented by the complementary percentage (1-p) of the proportion of road extensions with traffic points (p). This method is applied with the aim of excluding the traffic effect and highlighting the consequences of drivers’ driving behavior and damages in infrastructures. It is considered more intuitive, in fact, to consider the negative polarity of the indicator, linked to dangerous situation in the provinces.
In order to make a direct comparison between the synthetic indicators referred to the years 2016 and 2017, therefore, the polarity was reversed for the 2016 indices already disseminated (see data tables Table 2.19).
FOR FURTHER INFORMATION
Big data Committee. Annual report 2017 (§ 5.3)
Geographical localization of road accidents on WGS84 system and use of Open Street Map for road safety performance indicators on the Italian road network (Broccoli M., Bruzzone S., CARE experts group meeting Brussels 24 January 2018 – European Commision DG-MOVE Mobility and Transport)