

- Home
- /
- Infographics
- /
- Infographic on road accidents...


Infographic on road accidents - Year 2025
Infographic on Road Accidents – Year 2025
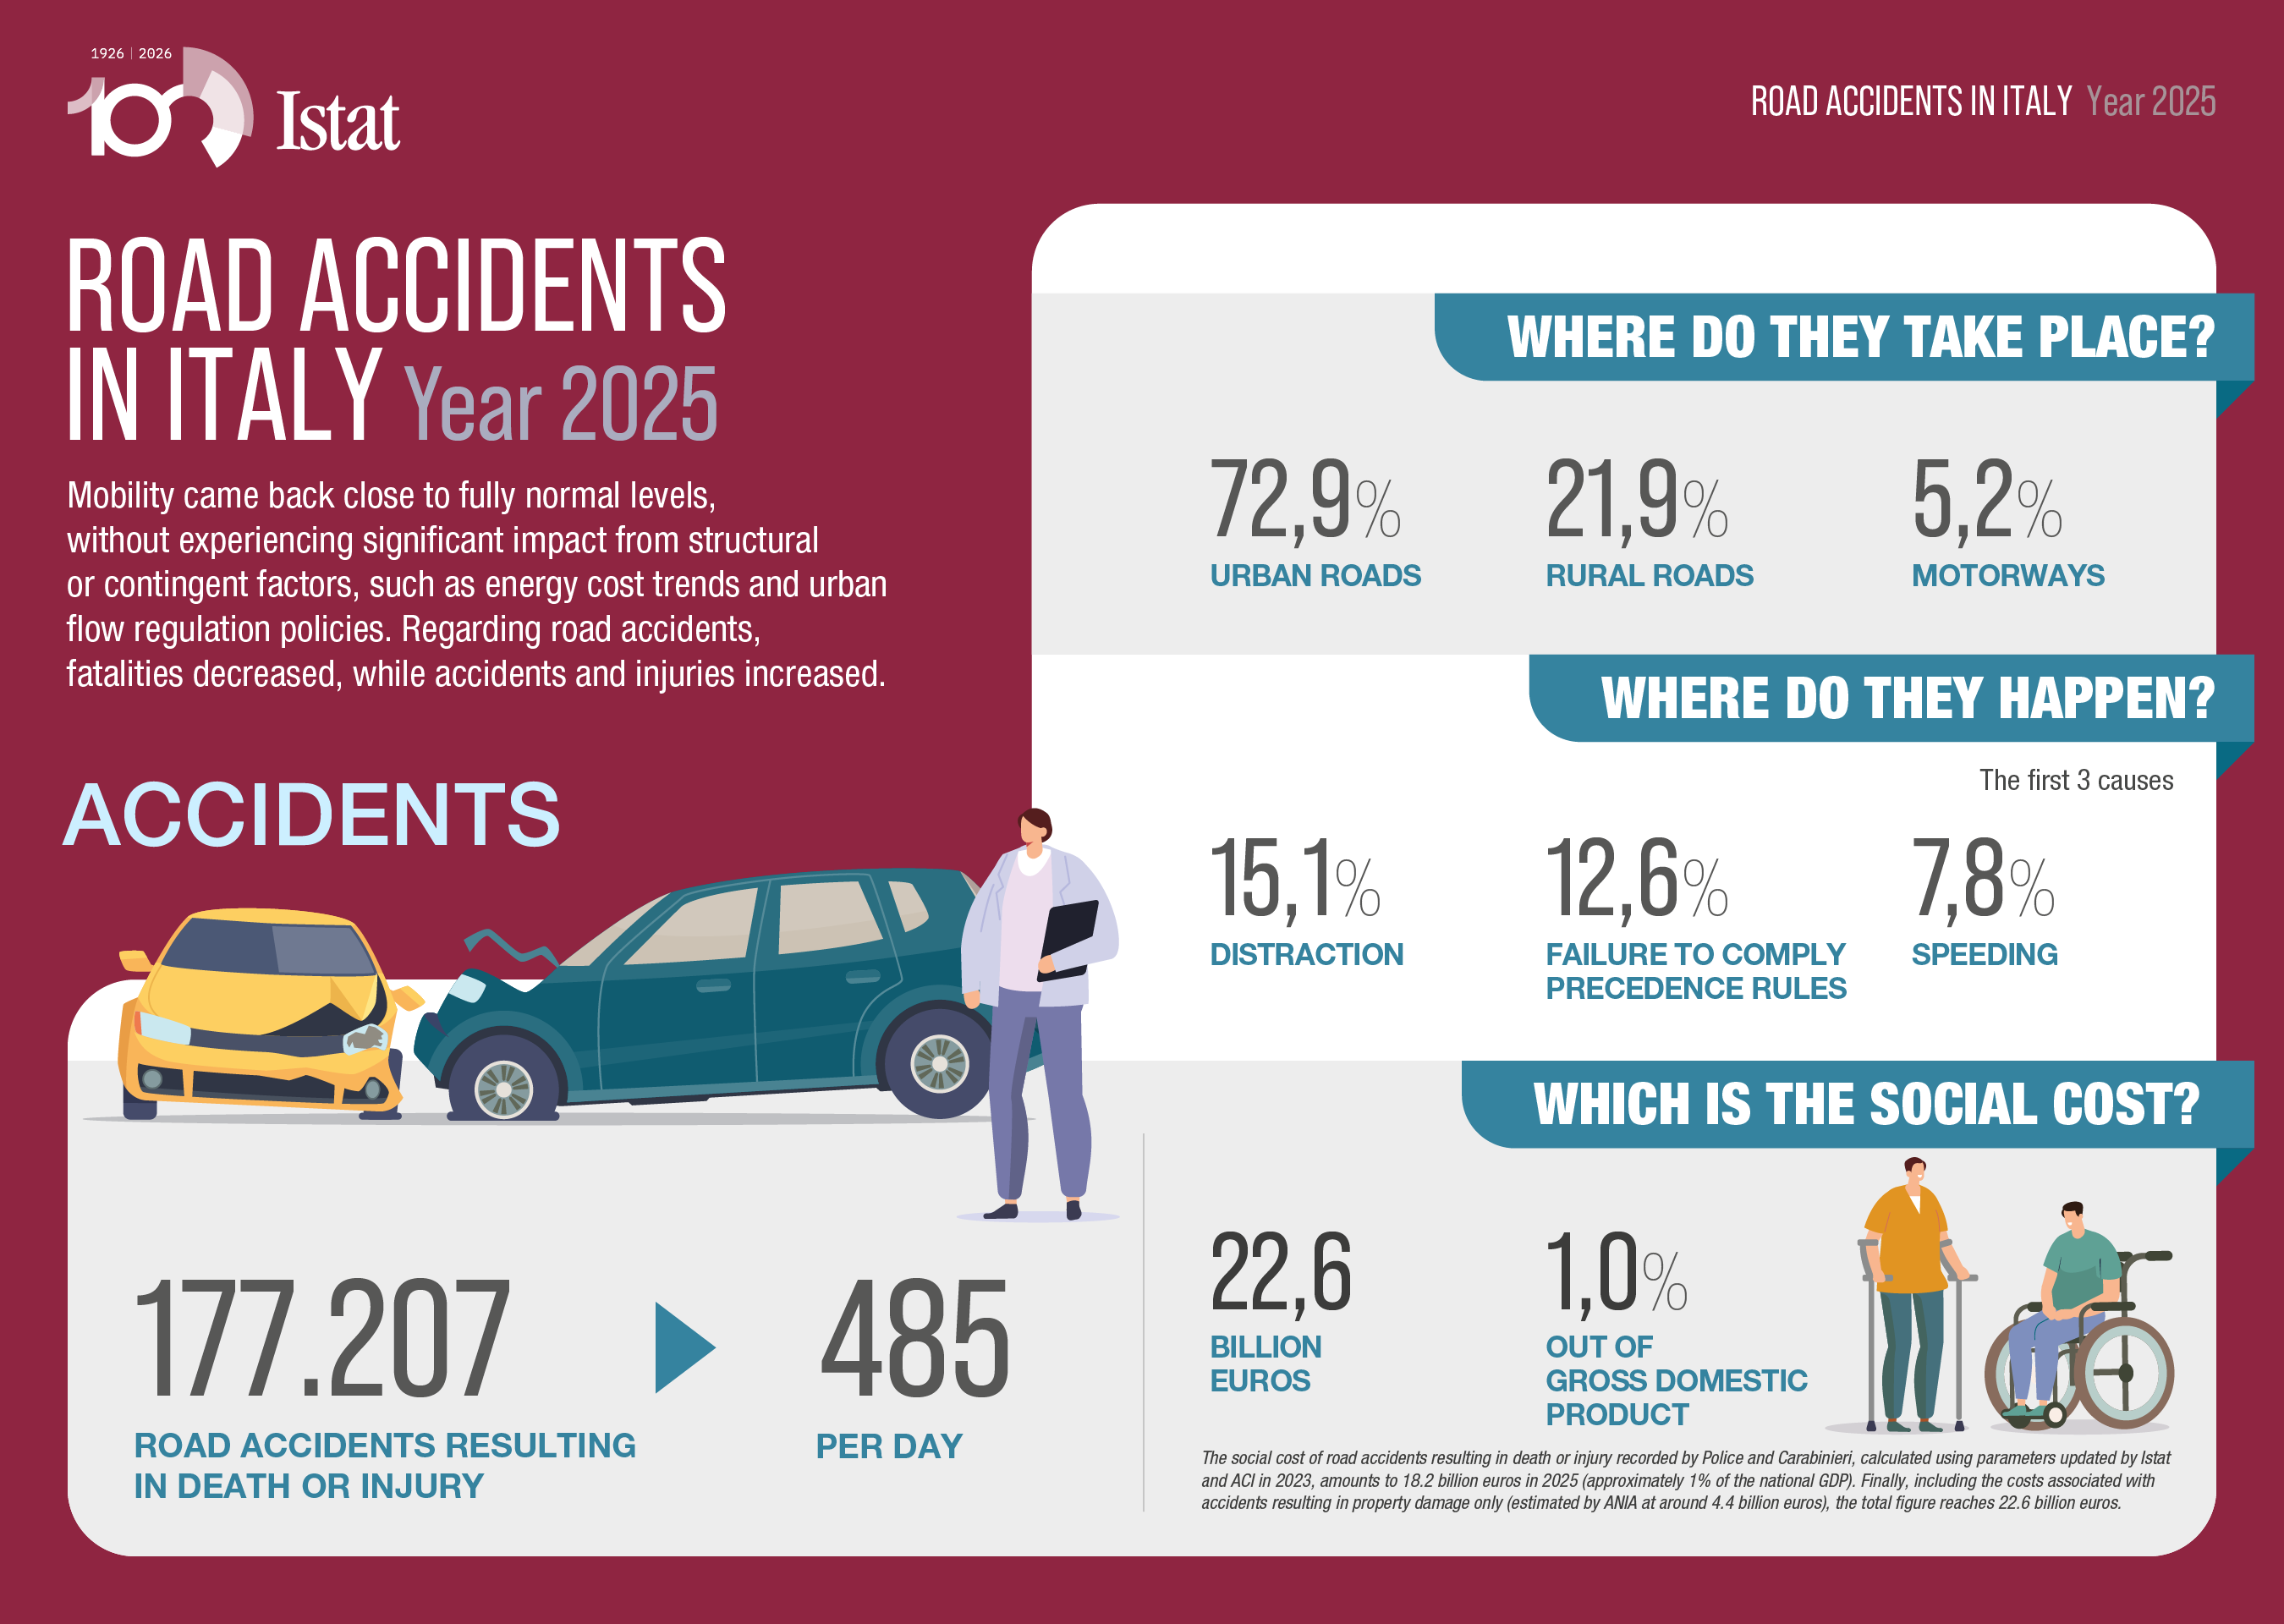
In 2025, mobility came back to near-normal levels. Energy costs and urban flow regulation policies did not significantly affect it. Accidents and injuries increased slightly, while fatalities decreased.
Road Accidents resulting in death or injury
- Accidents: 177,207
- Daily average: 485 accidents
Where Accidents occur
- Urban roads: 72.9%
- Rural/out-of-town roads: 21.9%
- Highways/Motorways: 5.2%
Most Frequent Causes
- Distracted driving (15.1%)
- Failure to yield right-of-way (12.6%)
- Excessive speed (7.8%)
Social Costs
- Social cost: €22.6 billion
- GDP percentage: 1.0% of GDP
- Includes both injury-producing accidents and that involving property damage only.
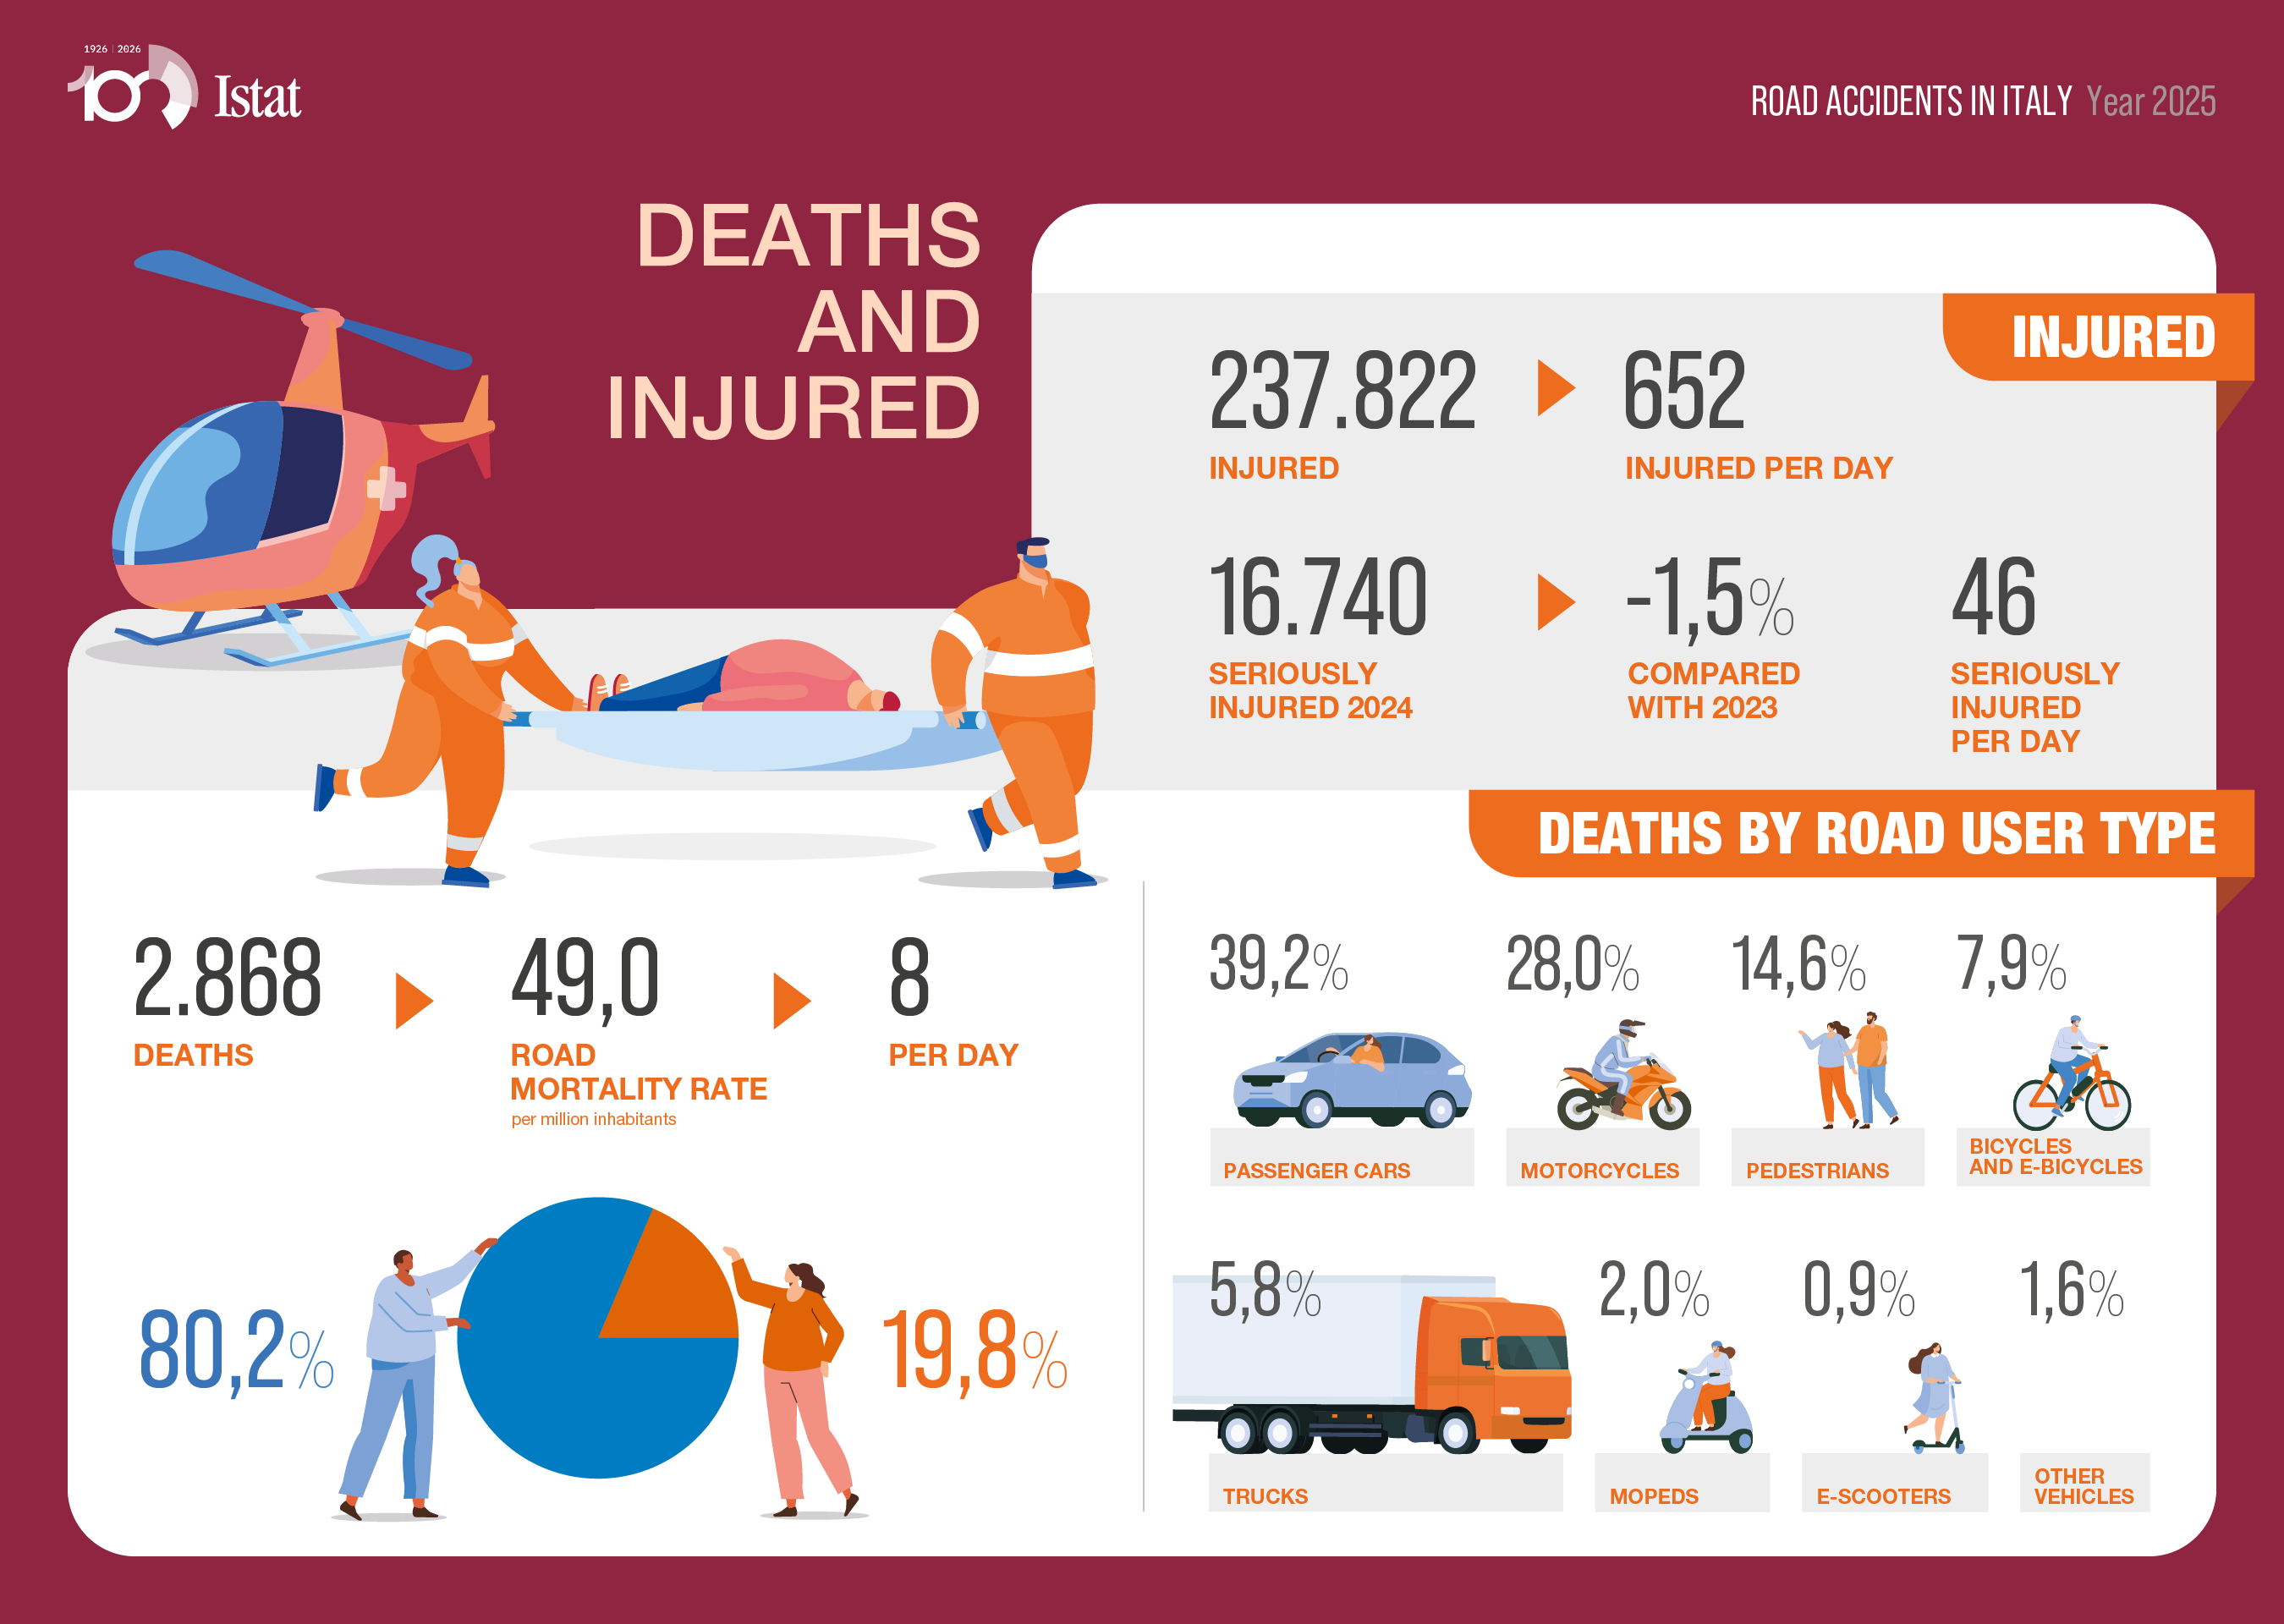
Casualties and Injuries
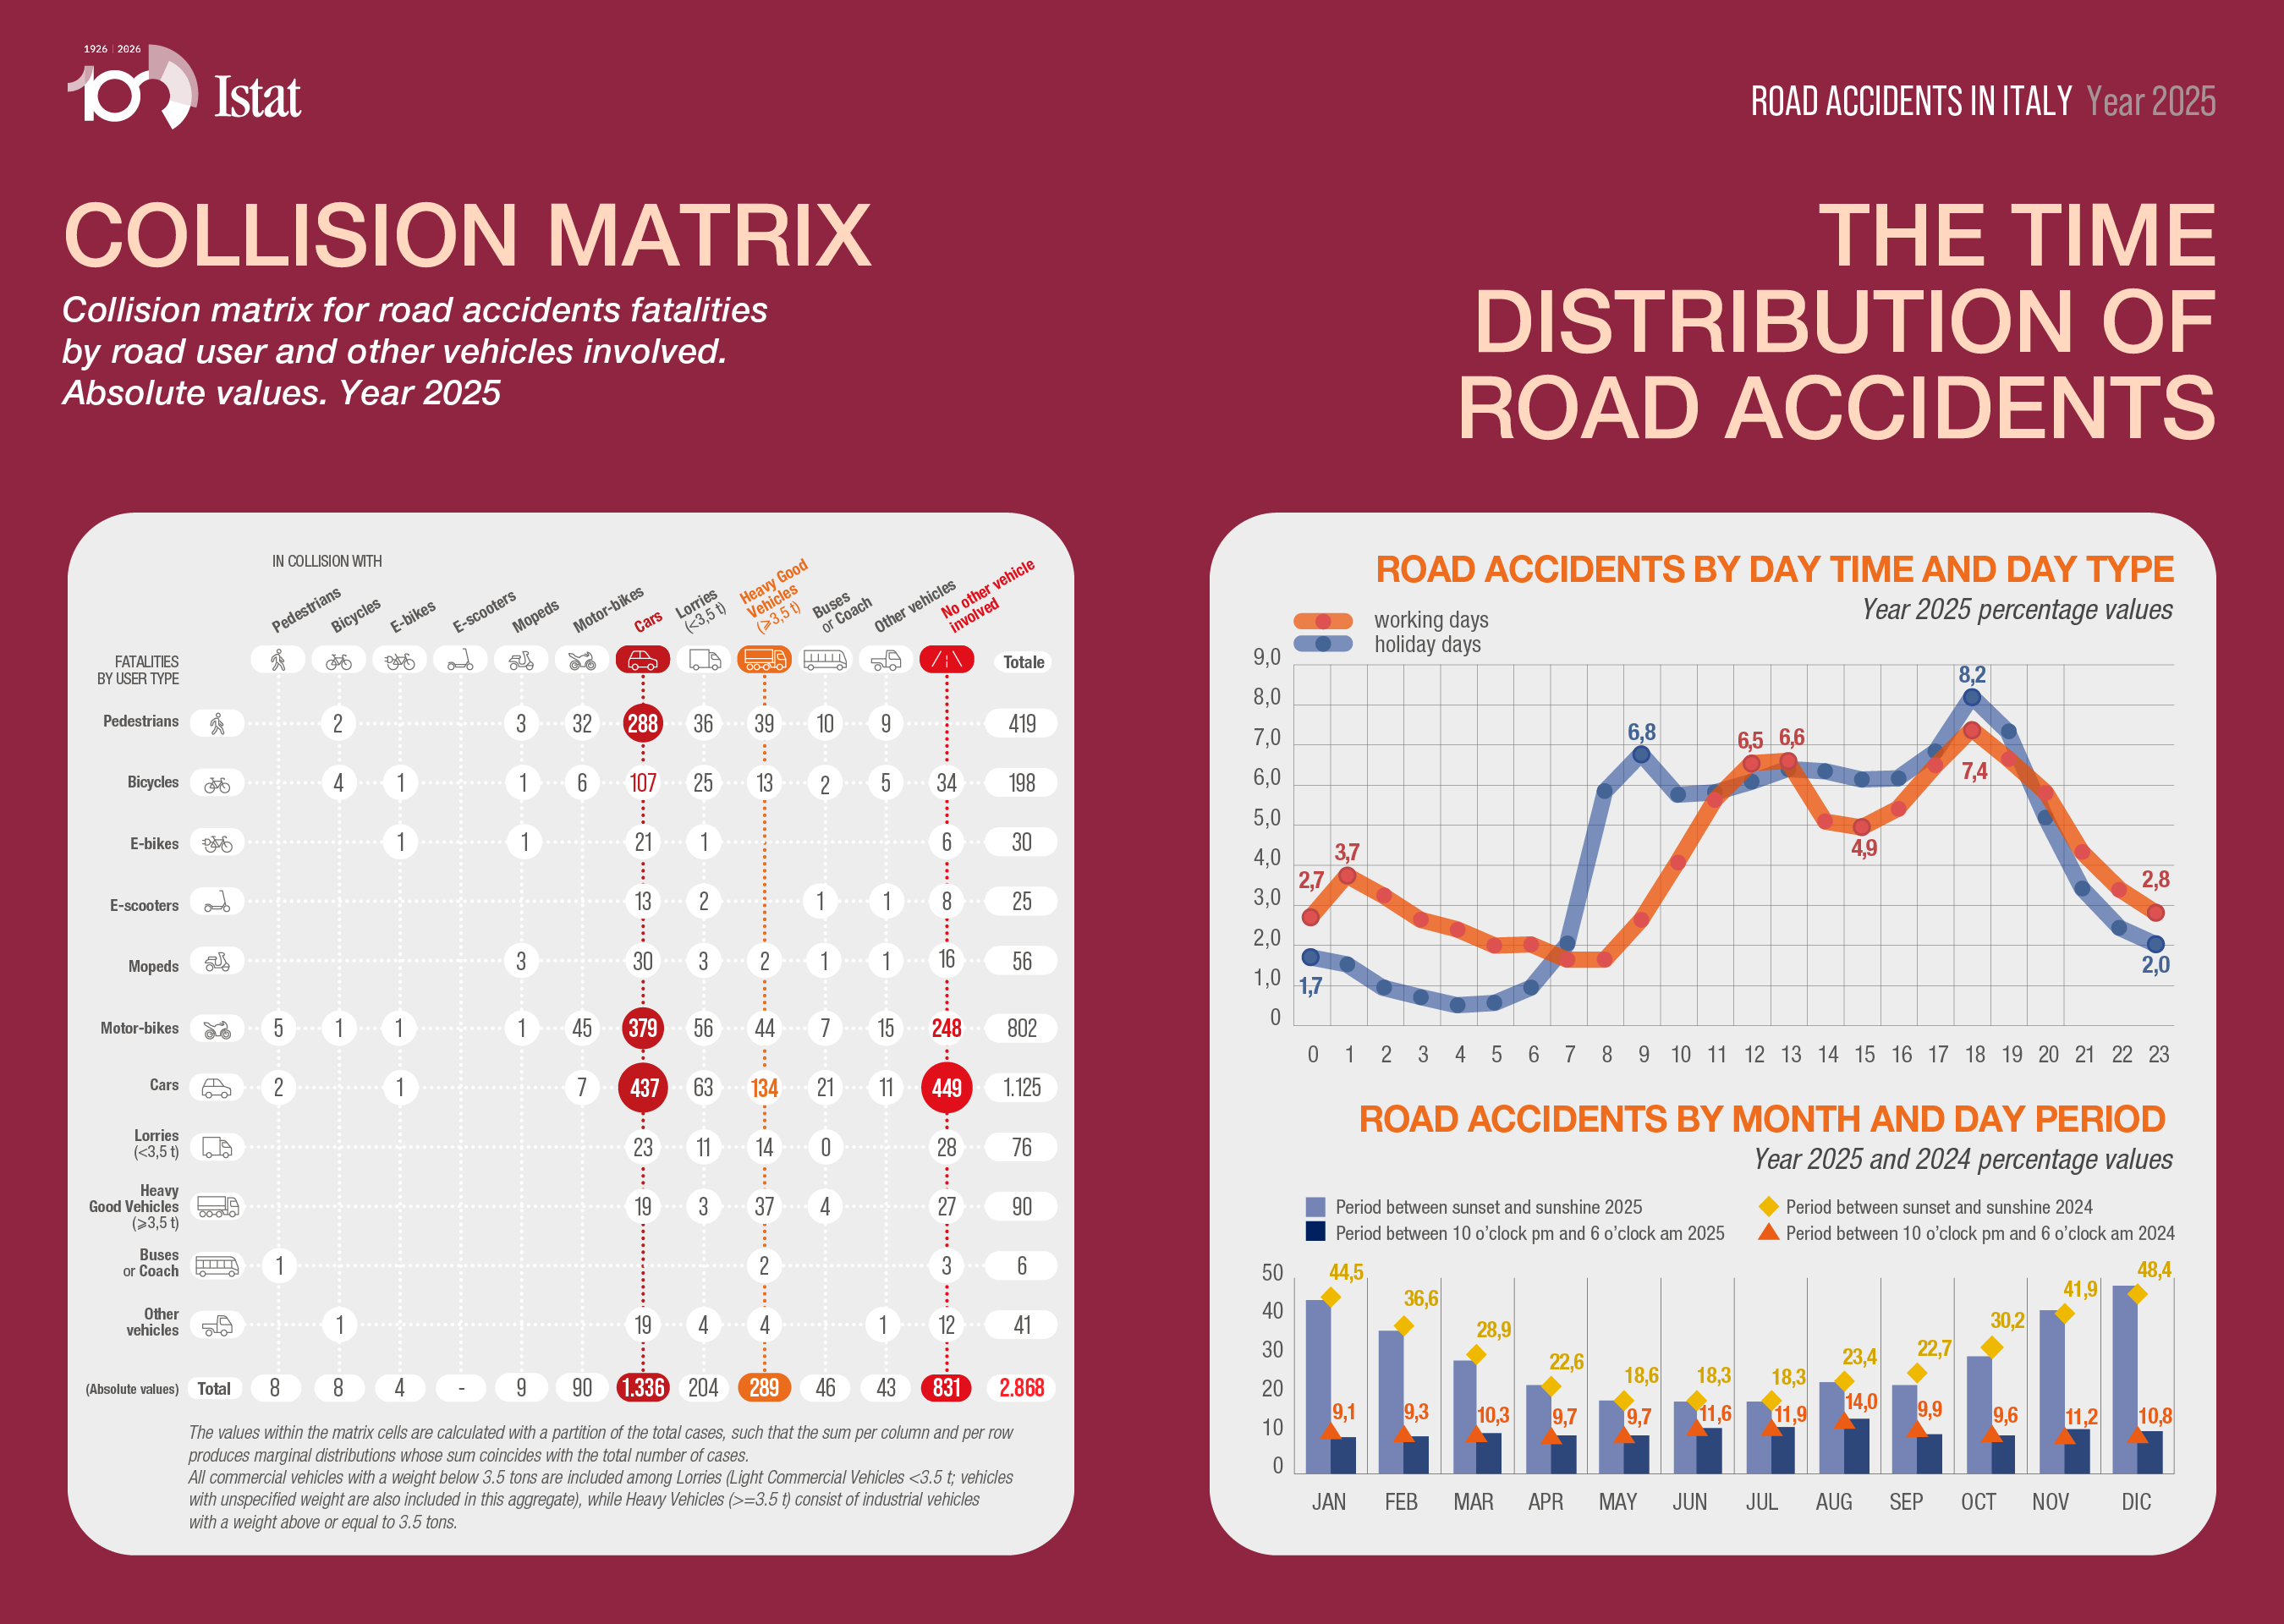
- Fatalities: 2,868 (8 per day; mortality rate of 49 per million inhabitants)
- Injuries: 237,822 (652 per day)
- Serious injuries (2024): 16,740 (~46 per day), down 1.5% compared to 2023
Fatalities by Road User Category
- Passenger car occupants: 39.2%
- Motorcyclists: 28.0%
- Pedestrians: 14.6%
- Bicycles/E-bikes: 7.9%
- Trucks/Lorries: 5.8%
- Mopeds: 2.0%
- E-scooters: 0.9%
- Other: 1.6%
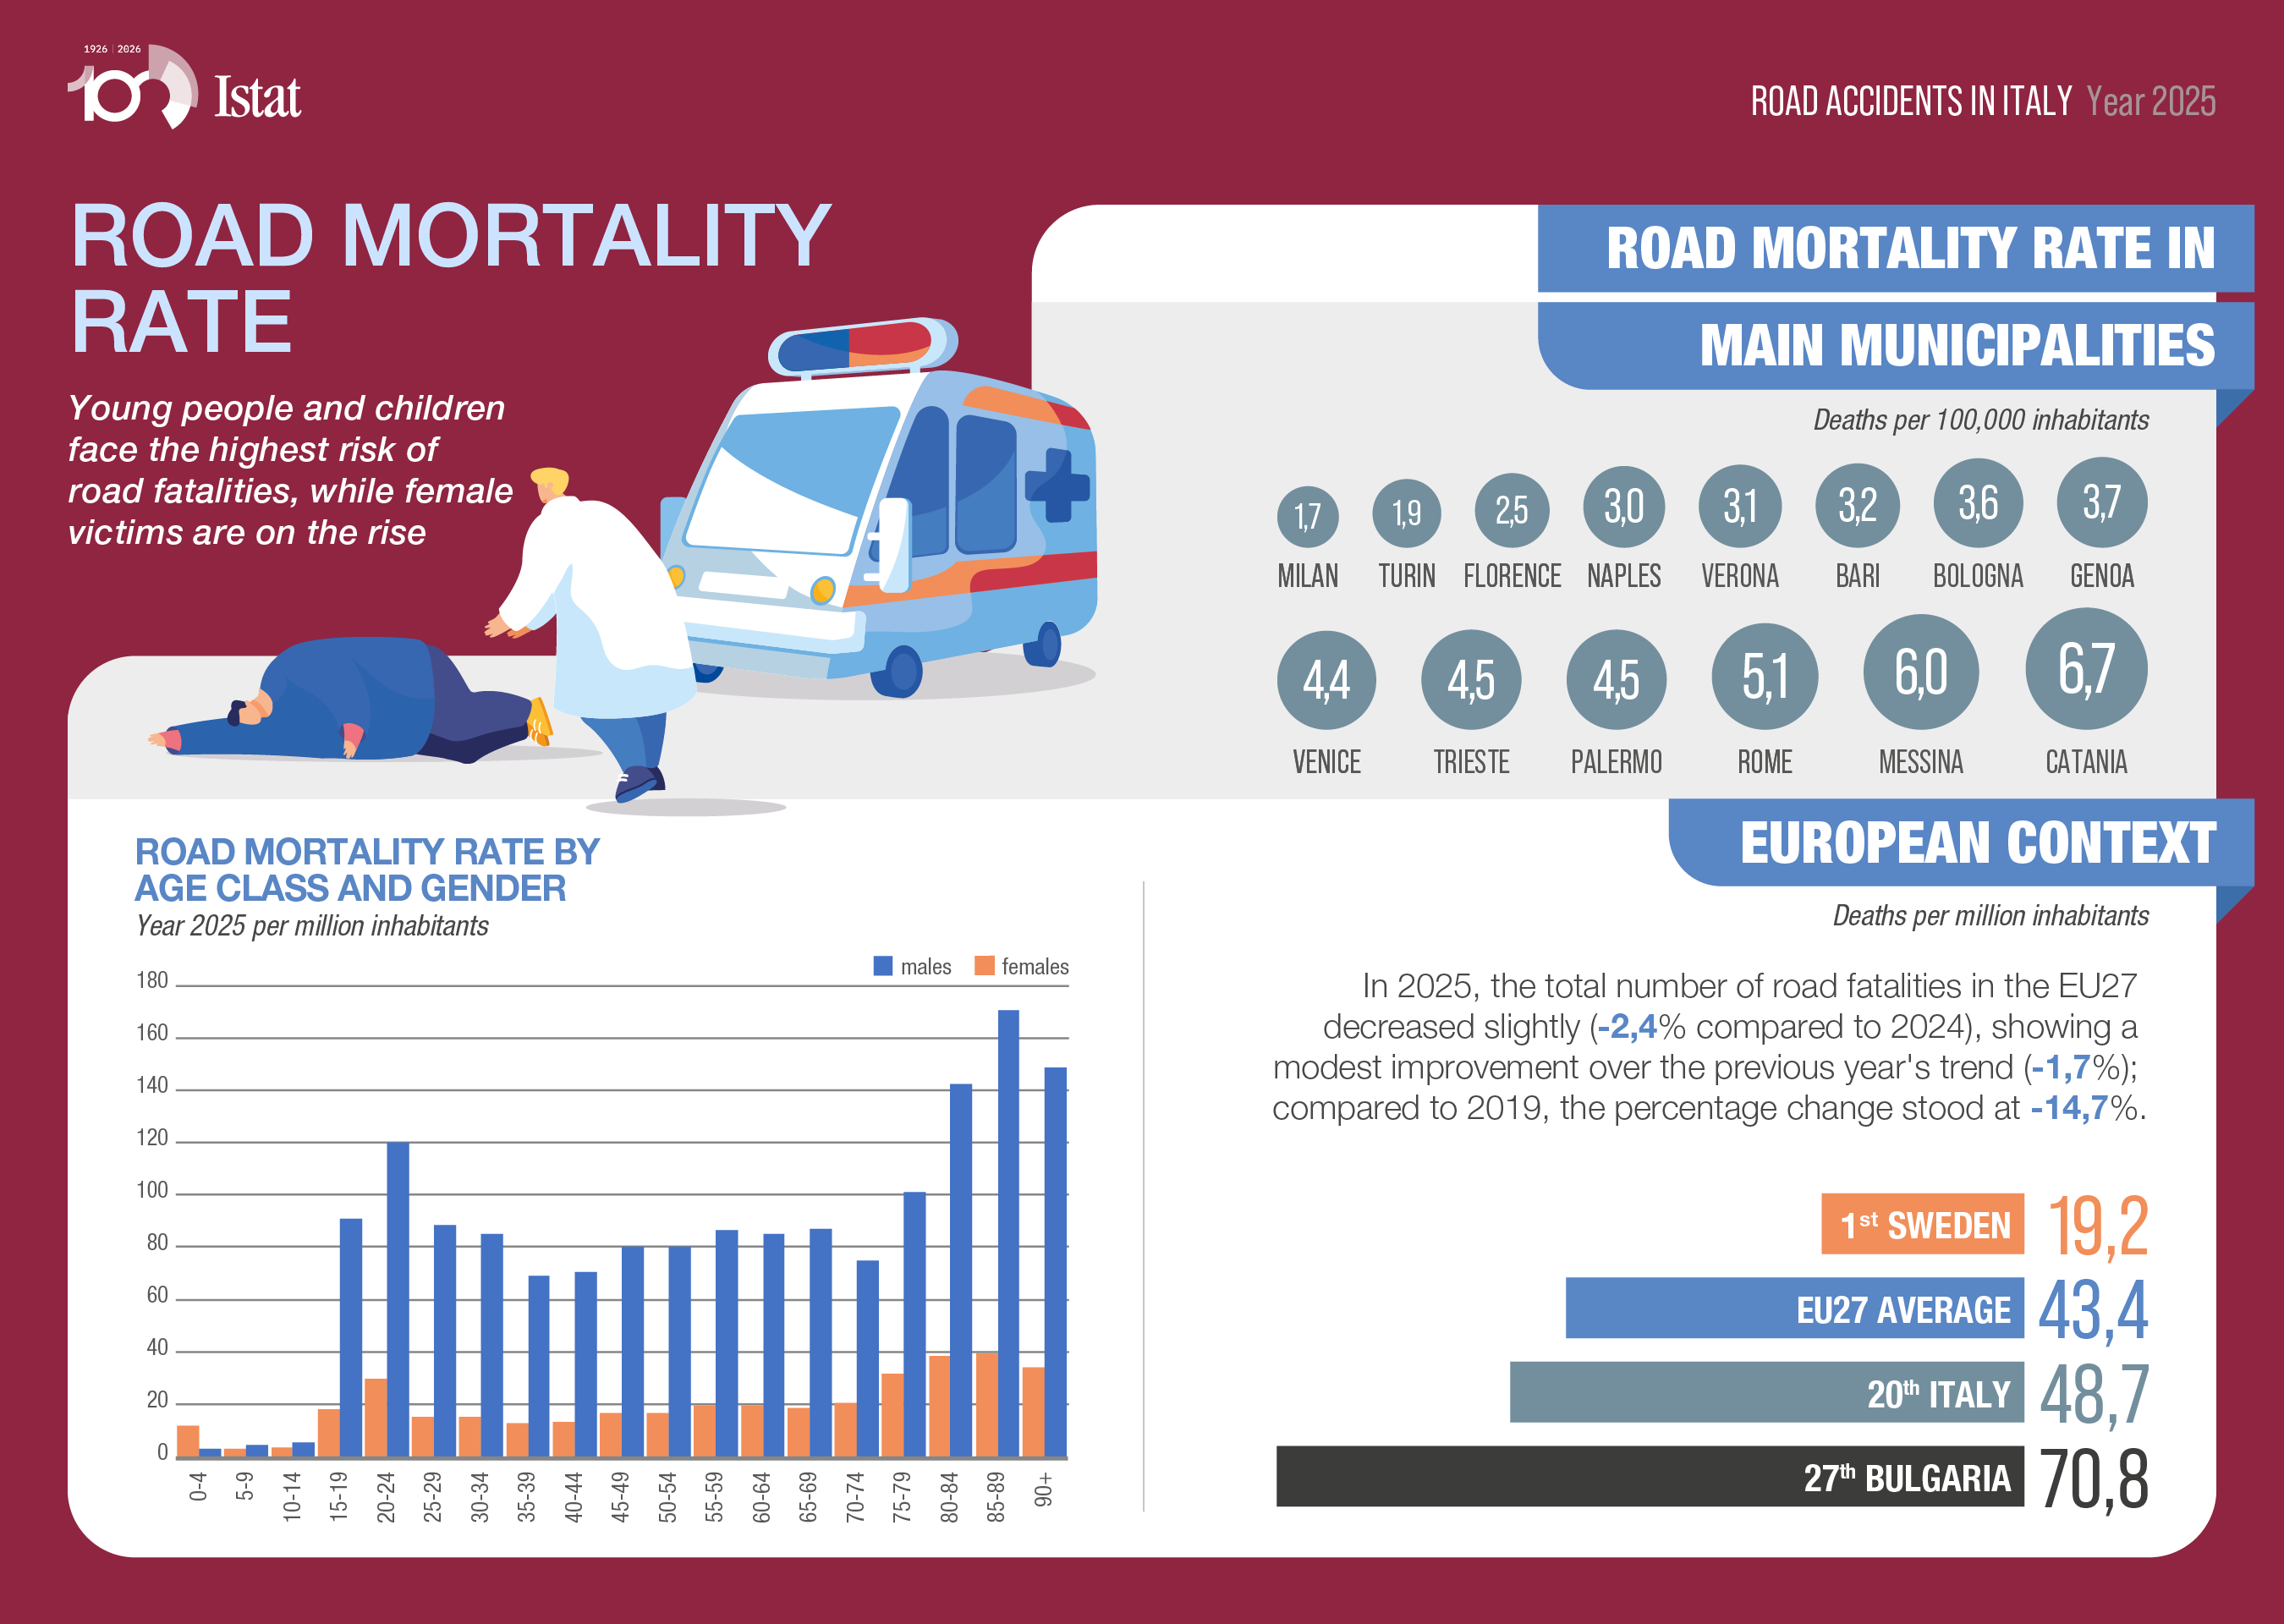
European Context
In 2025, fatalities per million inhabitants decreased by 2.4% in the EU27 compared to 2024. Italy recorded 48.7 fatalities per million inhabitants, compared to the EU27 average of 43.4.
Major Municipalities The mortality rate ranges from 1.7 fatalities per 100,000 inhabitants in Milan to 6.7 in Catania.
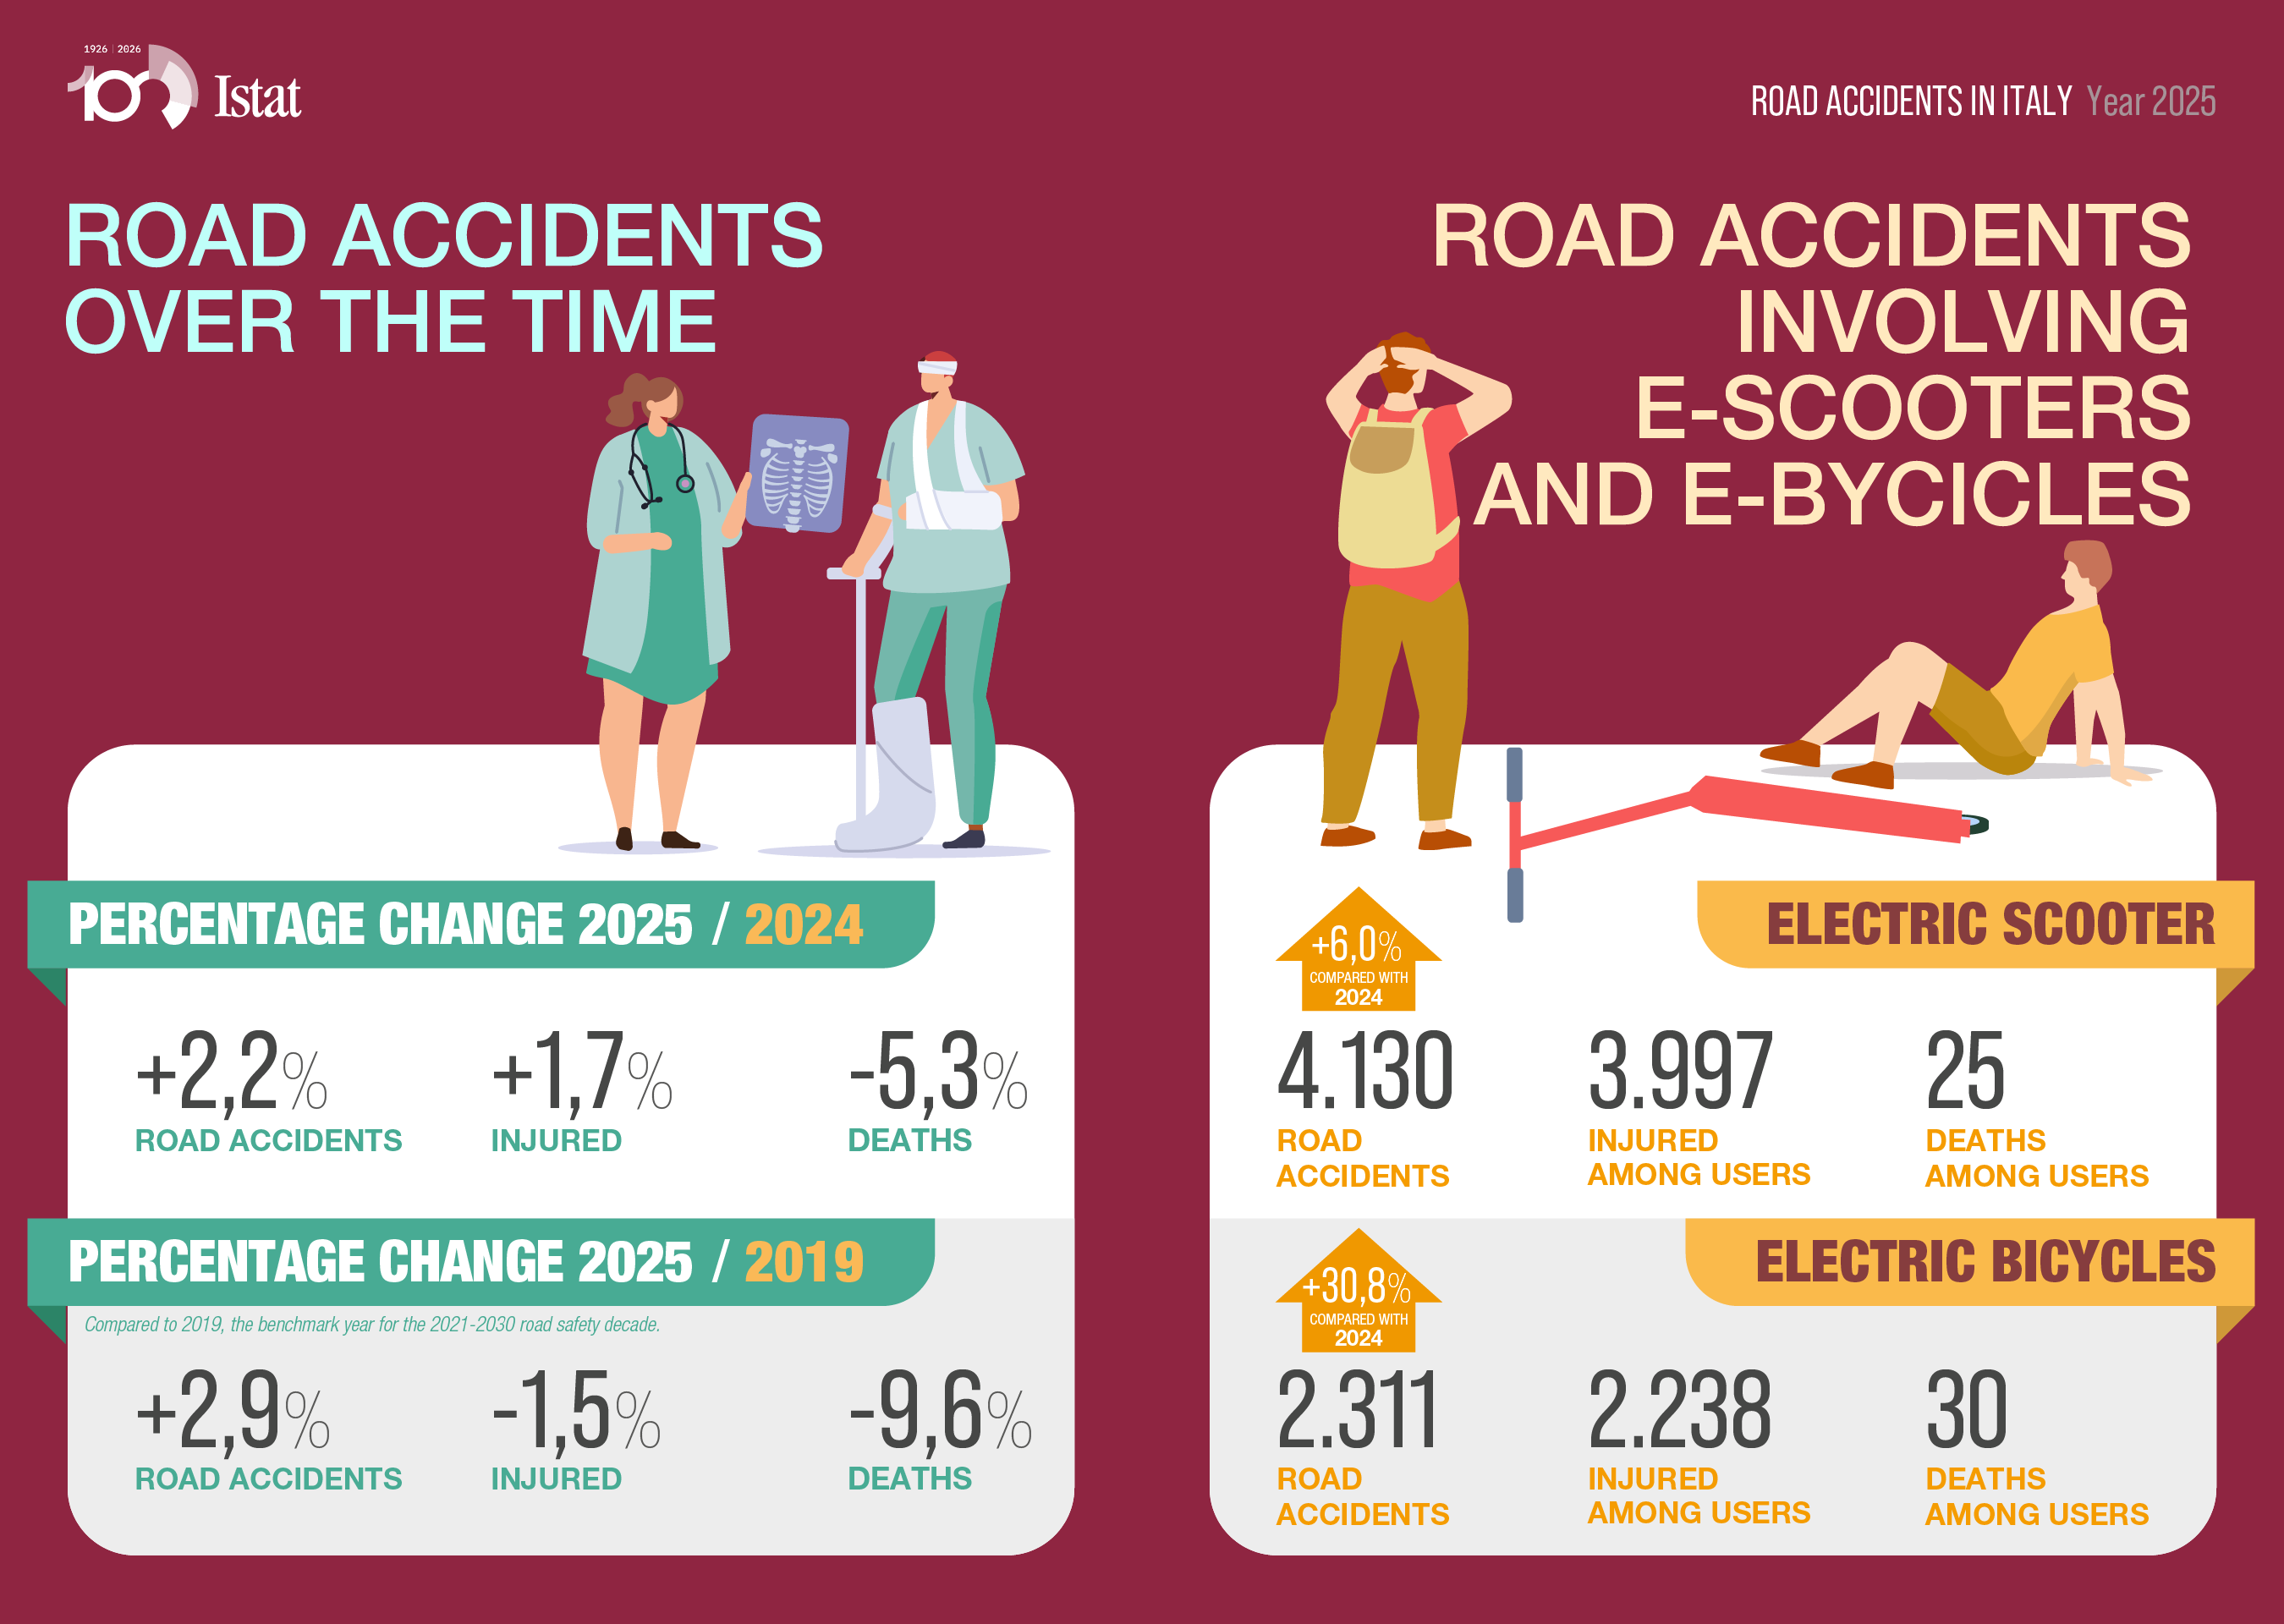
Accident Trends Over Time (in 2025)
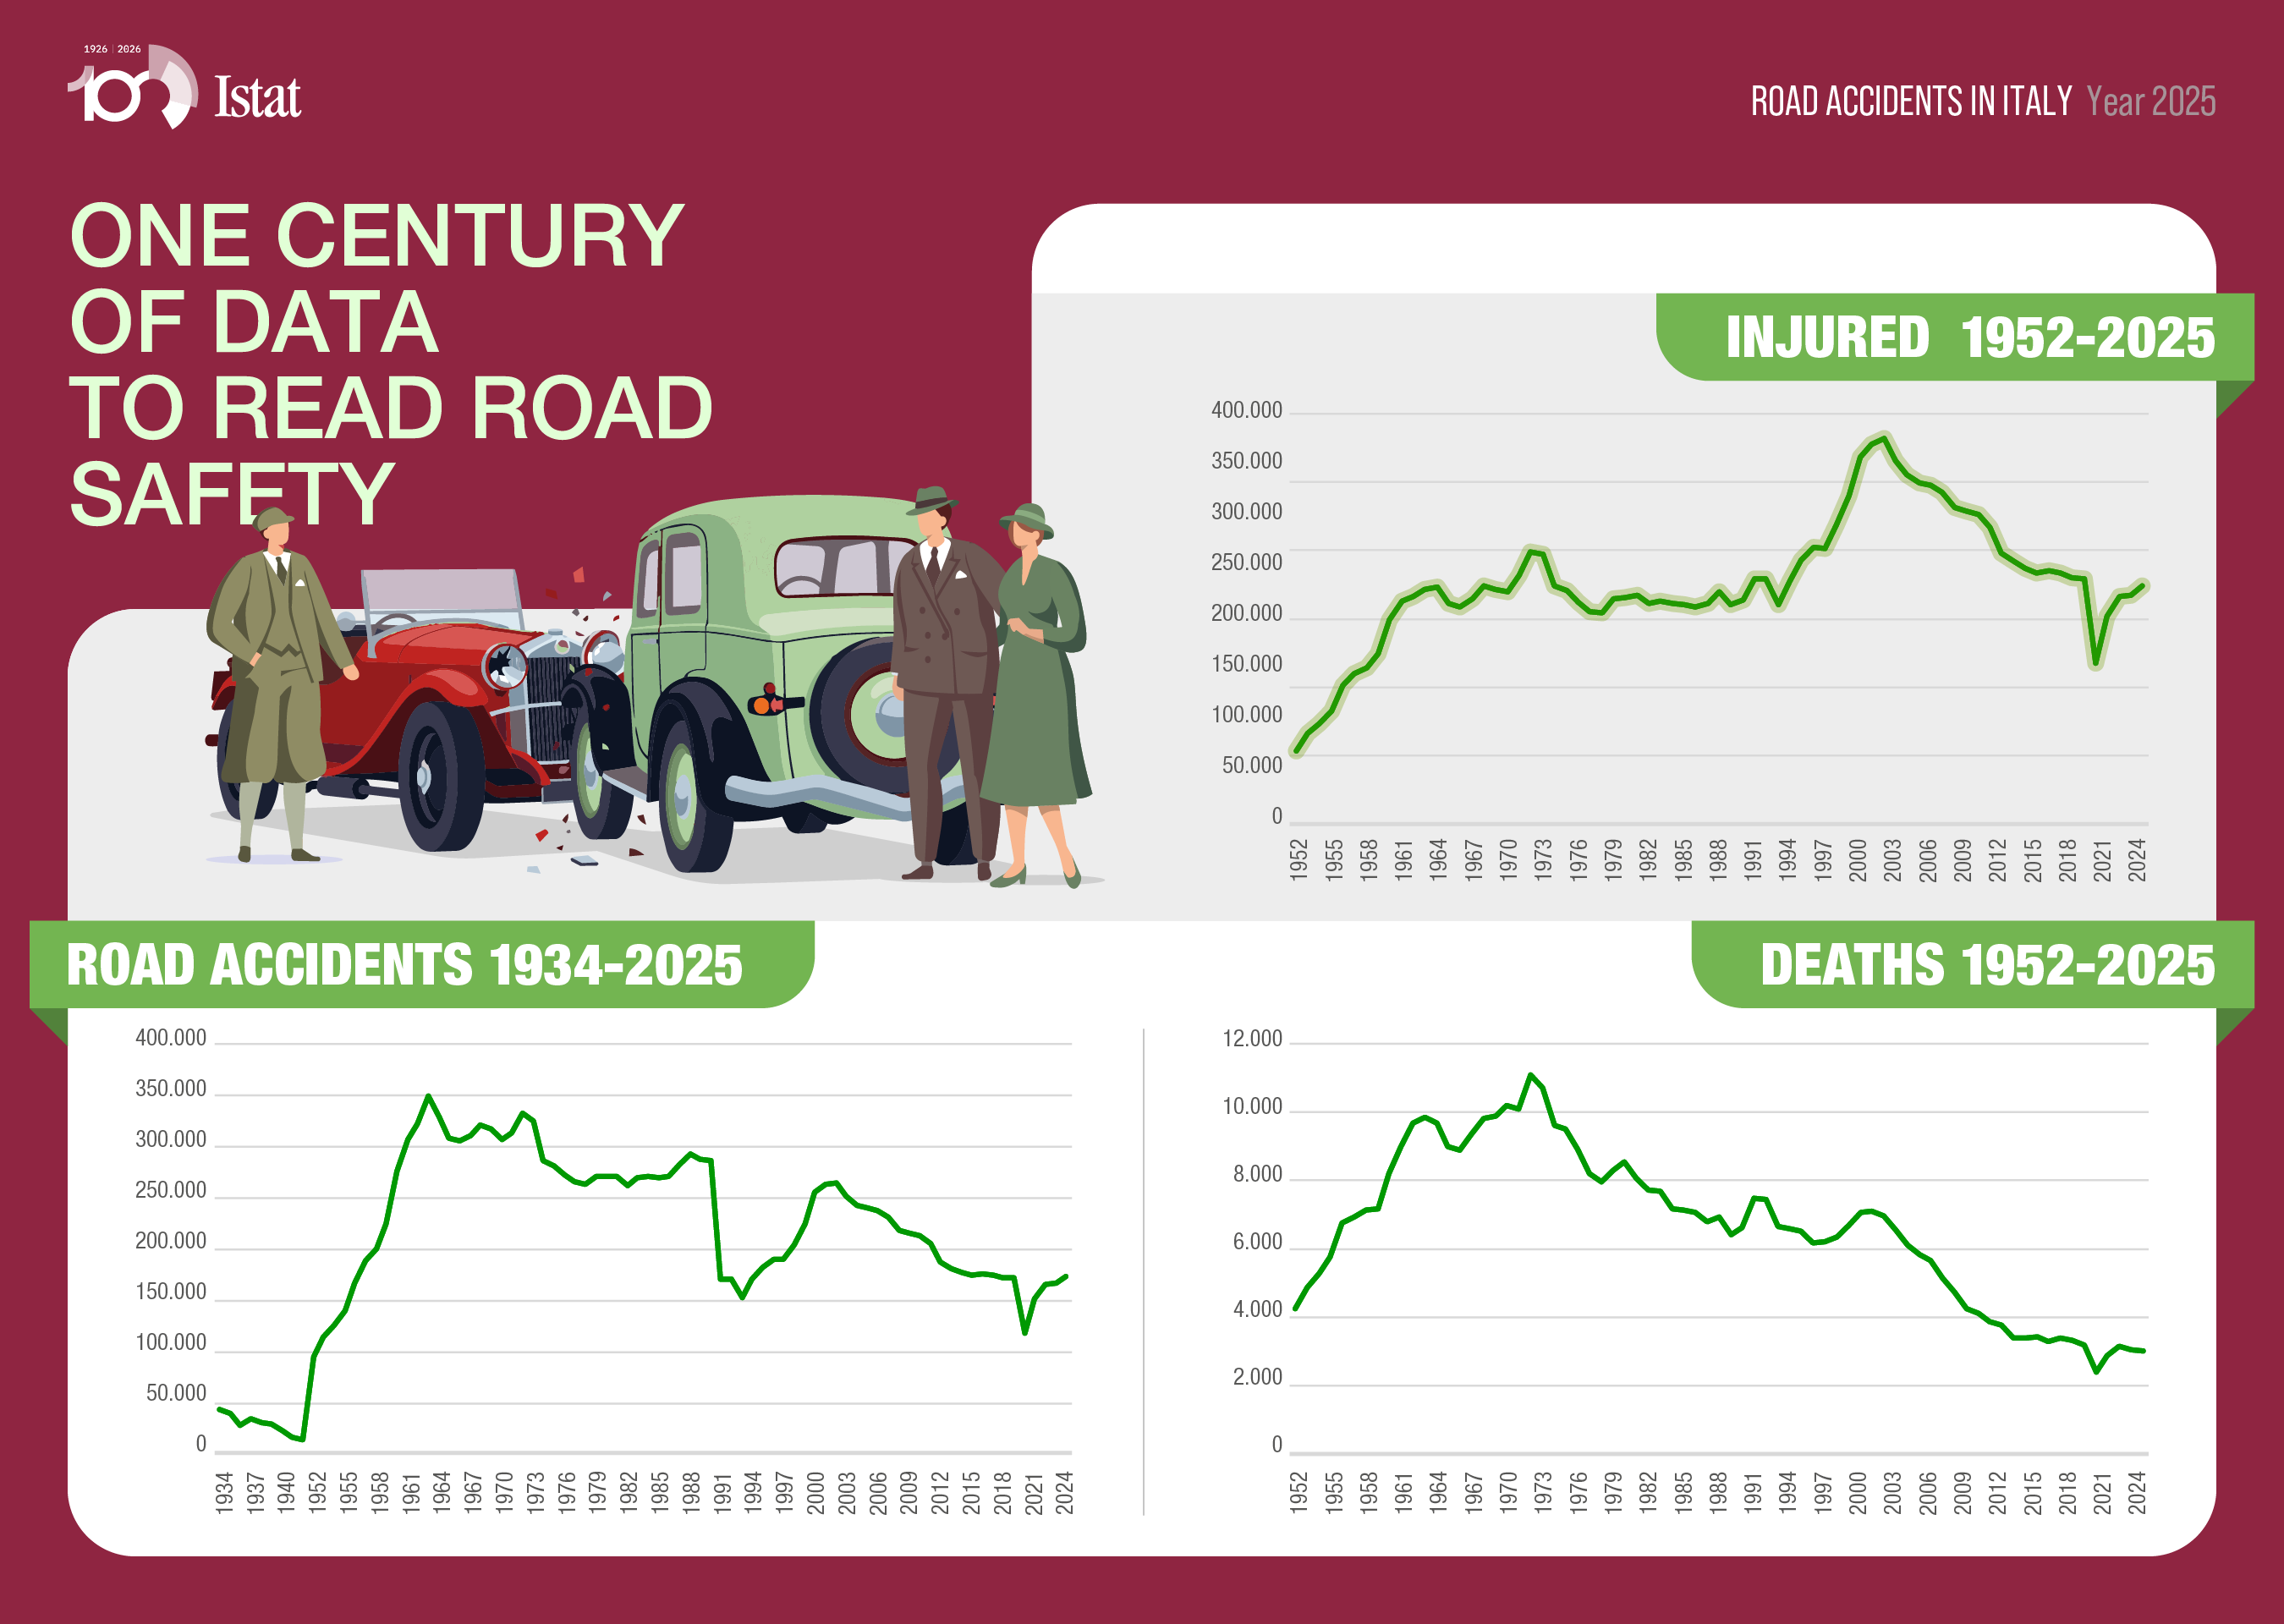
- Compared to 2024: Accidents +2.2%, Injuries +1.7%, Fatalities -5.3%
- Compared to 2019: Accidents +2.9%, Injuries -1.5%, Fatalities -9.6%
E-scooters and Electric Bicycles (in 2025)
- Electric scooters: 4,130 accidents, 3,997 injuries, 25 fatalities
- Electric bicycles: 2,311 accidents, 2,238 injuries, 30 fatalities
Go to Press release