Mappa interattiva dei flussi di pendolarismo

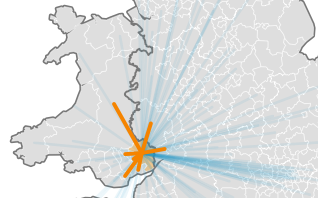
Flussi di pendolarismo per motivi di lavoro, 2011
Anno:
Motivi di:

loading commuting data. please wait...
I flussi significativi evidenziati in rosso usano un metodo adattato
da Holmes and Haggett (1977).Holmes and Haggett (1977).
Unfortunately, your current web browser is not able to display our commuting visualisation. This advanced mapping application is compatible with most modern web browsers which support open standards. These include:
Users of earlier versions of Internet Explorer (version 7 or 8) can choose to install the Google Chrome Frame plug-in to enable the application to run from within their current version of Internet Explorer. Alternatively, you can download the underlying data used in this graphic from ONS Commuting Estimates.
Users of mobile devices with version 5+ of Apple iOS (iPhone/iPod Touch/iPad) or version 3+ of Google Android (tablets/smartphones) should also be able to access the content.